Along with the New York Times’ needle of death, perhaps no infographics are as associated with the 2016 election as voting maps.
You know the ones: A Democrat would post an almost psychedelically stretched-out cartogram of the continental U.S. shaped by vote population distribution, because, as you recall, Hillary Clinton got 3 million more votes.
A Republican would then put up a very different map showing all the counties that voted for Trump and making the U.S. look like a sea of red — never mind that a lot of those rural counties have fewer inhabitants than a single block in Manhattan. (Donald Trump put a version of this map on a wall in the White House.)
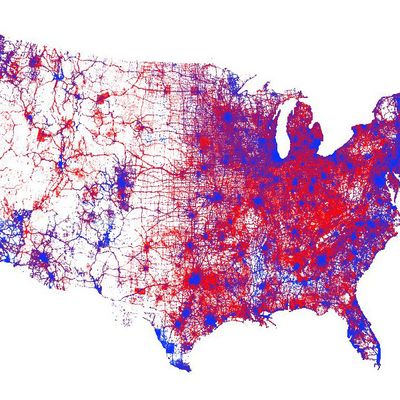
Now, some 16 months later, perhaps the fairest and most nonpartisan version of the electoral map yet has gone a little bit viral: one that includes a dot representing every single vote cast. That’s 65,844,954 blue dots for Hillary Clinton and 62,979,636 red dots for Donald Trump.
In this new version, cartographer Kenneth Field wanted to include all votes — not just those of the victor in each area. Field says Trump’s map isn’t “incorrect … [but] there isn’t just one way of mapping the data”; Field also wanted to make “a map that pushes the data into areas where people actually live.”
To make this “dot-density” map, he used ArcGIS software from Esri, the company where he works, to illustrate information from two government data sets, one on election results and the other, the USGS’s “brilliant” national land-cover database. To the uninitiated, populating a map with more than 130 million dots might seem almost like an act of magic, but once he’d gathered the needed data sets, Field says making this version of the map took him only … 35 minutes. (Field aims to make a more user-friendly, zoomable, hi-res version when he gets the time in the next few weeks.)
Does the map tell us something “new” about the election? Overall, it doesn’t upend any key demographic conventional wisdom: The coasts and urban areas are mainly blue, and the rural Midwest in particular mainly red.
But online, some people seem be finding (for them at least) surprising nuance within this version’s gashes of red, and strips of blue: “Wow, having lived in Texas most of my life, it’s crazy seeing so much blue in the 4 largest cities (Austin, Dallas, Houston, and San Antonio),” noted @StaceyTurner77. “It’s quite interesting to ‘see’ that our ‘unsafe borders’ are so predominantly blue. You’d think if the residents/citizens/voters in those areas believed the Republican theory/solution would work, those areas would be redder,” observed another reader. “Rather than solid red, you see that basically the west is pretty freaking’ empty,” said a third.
Might some American voters be starting to actually contemplate, rather than simply to react to, the vagaries of the 2016 election? “I’m a Republican,” started one series of tweets, “but I appreciate this map.”


