The screens are crawling with red and green. But mostly red.
“What is this?”
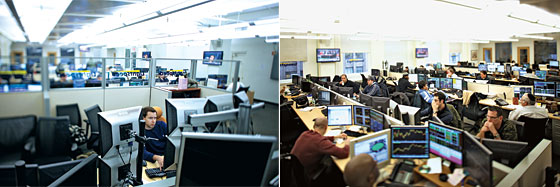
The stock market is headed down again, as it was yesterday and the day before that. A 32-year-old trader named Peter Milman sits slumped under fluorescent lights in an open-air trading office on Madison Avenue, surrounded by men just like him: rows of traders in jeans and T-shirts and hoodies, faces slack, staring at banks of monitors that jump with charts and graphs and gauges, the only sound the tapping of computer keys—and the occasional expletive.
“Fuck me!”
On this day in mid-November, President Bush is in Manhattan trying to reassure investors, but it doesn’t seem to matter. Treasury Secretary Hank Paulson’s announcement that he’ll scrap his original $700 billion bailout plan for financial institutions has sent the market into a tailspin. Milman’s monologue reads like an emotional ticker tape: “Fuck. Shit. Oh my God. Unbelievable. Oh God. Wow. Oh God. Wow, wow.”
And then, without warning, it happens: The market strikes an invisible bottom, the indexes reverse course, and stock charts head skyward. Perhaps it’s the glimmer of hope in the forthcoming meeting of the G20? Or plummeting oil prices? Milman doesn’t know why—or care. “Oh my God,” he says, whacking furiously on his keys, buying in as the market rises, then quickly selling off, over and over again, up, up, up. He leans off the edge of his seat now, like he’s trying to tilt the market to his will, a pinball wizard at the arcade. His monitor is streaked with green lines edging higher, his profit-and-loss gauge flipping numbers like a slot machine, punching up hundreds of dollars per second, point by S&P point—then thousands per second: green, green, green.
“Come on, NASDAQ, follow!” he hisses, urging it on. “C’mon, sixes, S&Ps! C’mon, let’s see fives, NASDAQ!”
The room is alive with chatter, row after row. The men lean into their screens, adrenaline surging. “Beautiful,” says a nearby trader.
“That is so fast,” whispers Milman. “Wow.”
In recent months, as the stock market has virtually spun off its axis, most people—the reasonable ones—have fled for their economic lives. But like a big-wave rider or a tornado chaser, Peter Milman dives in and out of the market’s sickening maw, riding the explosions of panic and greed and trying to snatch victory—profits—from the jaws of worldwide financial defeat. As a day trader who follows every tick of the Dow, he has a visceral view of the most manic-depressive stock market in recent history.
It is precisely the terrifying volatility—the VIX, the ticker symbol for the Chicago Board Options Exchange Volatility Index, has reached its highest recorded levels in recent months—that has made day traders suddenly hot again after years in the wilderness following the dot-com bust of 2000. (In fact, they don’t call themselves “day traders” anymore, preferring the term “active,” or “professional,” traders.) Downswings of hundreds of points on the Dow followed by equally large reversals offer great opportunities for the short-term investor. One need only jump in and chase a stock or an index for a few points: Buy in, sell off, repeat. Traders try to make money on the upswings and the downswings, in the latter case by short-selling—temporarily covering a long position for another party on the bet that his stock will go down. But Milman prefers to hitch a ride on the rebounds, the style of trading he learned during the bull market.
Throughout the fall, when the Dow Jones regularly swung 200 points in a single day (with one record-breaking 1,000-point swing in October), Milman experienced the most lucrative trading he’s seen since the late nineties. In December, as hedge funds liquidated en masse and the Federal Reserve tried to stanch the cash bleed at banks, prolonged upswings became less frequent, but traders continued to find pockets of momentum, especially at the end of the day, when there is typically a mad rush of trading before the bell. The bear market hasn’t slowed Milman down: He’s up roughly half a million dollars over the last three months. Last week, there was another flurry of volatility, with bad banking news sending the Dow plummeting to 7,949 points on Inauguration Day. The following day was a spiky roller-coaster ride, the Dow traveling down over 100 points, then reversing course for a 290-point gain. It was precisely the kind of day that day traders love. Milman made $18,000.
The percentage of traders like Milman is small, but it’s not just day traders who are approaching the market with a short time-horizon these days. Investment bankers and hedge-fund managers who might have once based their trades on extensive research and elaborate models are finding that their models don’t work in this chaotic environment. Some who otherwise would have shunned this kind of day-trading are finding it profitable to chase the minute-by-minute momentum. “It’s definitely not a buy-and-hold market,” says one investment banker. “This is a trader’s market.” Some out-of-work I-bankers are also trying their hands at day-trading, with varying degrees of success. Scott Redler, a partner at the trading group T3live.com, hired (then fired) a trader who had lost his job when one of the major investment banks closed last year. “He lost more than any of our traders because he didn’t understand the smaller time frame and risk,” says Redler. “They think they know how to trade and they lose because they don’t know what it takes.”
Unlike the big traders, Milman, a Russian immigrant who grew up in Queens, is trading his own money, managing roughly $2.5 million, much of which he’s accumulated over the past two years. He followed his brother Serge into day-trading just after graduating from New York University’s Stern School of Business. “I graduated in December of 1998, and in February 1999, my trading account was open,” says Milman. “I borrowed 50 g’s from my brother, and three months later, he was paid back in full. I never looked back.”
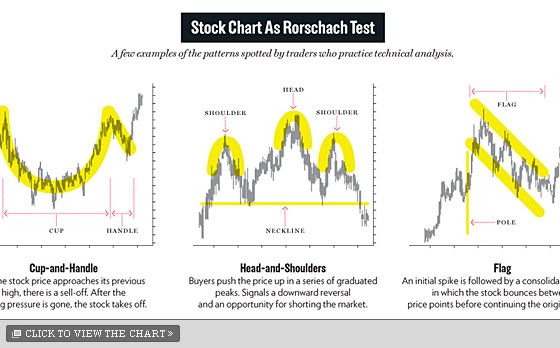
To manage risk, Milman practices what is known as technical analysis, a controversial method of prediction based on studying buying and selling patterns. In other words, he analyzes not the underlying value of companies but the movement of crowds. On any given day, Milman is trying to make an informed bet about how mutual-fund managers, hedge-fund traders, and assorted individuals like him are going to behave. To figure that out, he turns to charts of stocks or indexes like the S&P 500 to see if he can recognize shapes in their zigzag formations, like the “cup-and-handle” or the “head-and-shoulders,” virtual pictographs that signal that the market could break in a predictable way, up or down.
“By learning technical analysis,” says Redler, “you become a psychologist of the stock market and trading off the mood.” It sounds absurd, like divining astrological meaning from the Big Dipper or Orion in the night sky. But it’s not far removed from the age-old practice of “reading the tape.” Even Burton Malkiel, the Princeton economist who wrote the 1973 best seller A Random Walk Down Wall Street, which argued that technical analysis is a bogus method of prediction, admits that it’s a strategy that seems to be working now. “This is really a very unusual period,” he says. “Even though I’m known as someone who thinks a lot of this technical analysis is malarkey, there is evidence of short-run momentum, and it’s just particularly strong now.”
“Technical analysis has been thought of as a black art or voodoo,” says John Roque, a managing director at Natixis Bleichroeder, a Manhattan brokerage. “But it’s no different than a football coach watching film to prepare for his next opponent.” Certain trading “plays” are likely to show up again and again, decipherable in chart formations that technical analysts have given names like “dragonfly doji” (a stock that opens and closes at the same high) or the “abandoned baby” (a three-day reversal in which a stock goes up for a day, stays flat for a day, then crashes). “You need to see the same thing hundreds of times, imprinted on your skull,” says Milman. “That’s where you get your confidence. You’ve seen it a million times, that this has worked in the past and you don’t want to miss it.”
This kind of trading is not for the weak of stomach. Milman readily admits his system typically gives him only a slightly better than 50-50 chance at making the right choice, and several of Milman’s colleagues had vaporized their accounts on a few bad bets. The fact is, few traders are successful at this game. Don’t try it at home.
When I first watch Milman trade, it doesn’t seem like his system is working at all. The market has been open for an hour, and he looks deflated, unshaven and rumpled in a lavender-and-white-striped western shirt, his cell phone, wallet, half-eaten bagel, and cold coffee a gloomy still life on his desk. Asian markets and futures are down, and a number of poor earnings reports have Milman struggling in choppy markets. Having made an aggressive bet on Goldman Sachs at the opening bell—betting it would go up instead of falling further down—he has already lost $12,000. “It wasn’t as tight of a formation as I would have liked it to have been,” he says, beating himself up for not reading the signs correctly. “There are plenty of fake-outs. I wasn’t nimble enough to get out in time.”
Milman sits in the corner of a large open-air office owned by a company called Lightspeed Trading, which rents out trading terminals to independent operators and collects a commission for every trade. In exchange, each trader gets a bank of monitors and some special software that lets him (or her, although there is only one woman present) buy and sell quickly. Milman is loosely affiliated with a small trading group with the illustrious name Ronin Asset Management. In truth, it’s just his brother Serge and four other guys—Chad, Stevie, Mikey, and Perry—trading the money of one investor while Peter and another friend trade their own money at adjacent terminals. Together, they form an informal knitting circle in which they tip each other to whatever they’re seeing in the market or hearing from friends on their instant-message boxes. While they sometimes encourage each other to check out specific stocks or index movements, Milman admits that when they pile into a trade together, they also tend to lose together. “Usually, the more people that are in a position,” he says, “the less likely it is to work.”
If nothing else, their private corner of Lightspeed’s office space, partitioned with glass walls, serves as a kind of boys’ club, complete with a mounted bass on the wall, a marker board scrawled with in-jokes, and salty dude talk all around. At one point, the trader named Chad describes the S&P’s chart shape as forming a “vagina pattern.”
“Big V,” says Milman, smiling.
The morning trading is so uncertain that Milman is only dipping into the market in small increments, putting out feelers to see if he gets a pull in one direction or another. “Right now, it’s not working out. See,” he says, pointing to a financial stock he’s been following, “it just went down three points.”
By 10:30 a.m., he’s recovered some of his losses, but his profit-and-loss gauge is still flickering red, down about $3,000. His neighbor appears caught in a downdraft: “Shit! Fuck!”
Financial news trickles in over Lightspeed’s intercom, and the traders keep track, but they don’t necessarily act on it. For one thing, they often find that stocks move on news before the news is even announced. For another, stocks don’t always react to news predictably. When Goldman Sachs announced worse-than-expected earnings in December, the stock actually went up instead of down. “It just goes to show, you can’t peg it on news stories,” says Milman. “It’s got to be more than that.”
Within a few minutes, a pattern begins to emerge on his screen. Milman thinks he sees a cup-and-handle in the S&P 500, a U-shape on the chart with the leading edge forming the handle. Milman believes this could portend a jump up. Not that he knows what’s driving the buyers and sellers to form this shape, only that it appears to work more often than not—if in fact he’s actually looking at a cup-and-handle and not just some random pattern (and many technical analysts believe this pattern is only observable in three-to-six-month stock charts, not ones lasting mere minutes or seconds). “If it could break above this,” he says, pointing to where the handle is forming, “it could be a technical buy point.”
Or not: “There’s no pure science to it, you know,” Milman hastens to add. He ruefully recalls a day in October when he lost “a hundred, comma,” meaning $100,000. “I was convinced that the bottom was in and just got way too aggressive, and it decided to go against me. It was a disaster. I made it all back in the next two days. But it was definitely a rough day. I hit the bar after that.”
Despite all its technical aspects, the basic template for day-trading appears fairly simple: If in a short period of time a stock has been ranging between, say, $20 and $25, Milman will dub the low price the “support” level, the high price the “resistance” level—a perceived floor and ceiling for the volley of buying and selling. He looks for signs that a stock will break the support or resistance level and head in a new direction—up or down, depending on the day’s overall trend—to a new price range, wherein the tug-of-war between buyers and sellers, bulls and bears, begins anew. Usually, after three or four volleys—visually speaking, three or four clusters of short, tight zigzags lasting as little as a minute, what Milman calls a “consolidation”—Milman will make a determination about whether a “setup” has arrived and buy in just as the stock breaks the price level. If he times it right and a stock does in fact break out, he starts selling off as he reaches the next peak, collecting profits all the way up. If he doesn’t time it right, he now owns a stock that’s headed down instead of up. Typically, he doesn’t wait around to see how far down it will go; he simply sells and takes the loss.
Do the chart shapes Milman observes actually predict what will happen? Hard to say. In reality, the reason the stock may have broken its resistance level after three or four volleys between $20 and $25 could simply be that a random mutual-fund manager decided that he wanted the stock at $20. By joining the volley, the sheer force of his large capital infusion—billions of dollars, enough to fundamentally move the market—might have pushed the stock price past $25. But why it happened is of little consequence to Milman. What matters is that thousands of traders just like him are encouraged to give chase once a stock breaks its prior level, effectively forcing the price even higher as everyone starts buying in. In a kind of self-fulfilling prophecy, so-called momentum traders bet that other traders are thinking the same thing they are, piling in, in hopes of selling off before the momentum peters out. Which came first, the fundamental behavior of buyers and sellers or the widespread belief that these levels have consequence, effectively inspiring the behavior to occur? It doesn’t matter. Momentum is momentum.
By 11 a.m., the S&P 500 is still cascading down, down, down. The cup-and-handle was a red herring, and Milman seems embarrassed by the poor showing. A laconic newsreader on Lightspeed’s intercom quotes hedge-fund manager George Soros as saying that “a deep recession is now inevitable and the possibility of a depression cannot be ruled out.” A nearby trader snaps, “Shut up.”
By 1:49 p.m., the cell phone, wallet, half-eaten bagel, and cold coffee are exactly where they were this morning, but now Milman is stripped down to his white undershirt, the pungent smell of fear and sweat hanging in the air. Milman’s only down $43 now, but getting out of the $12,000 hole seems to have taken its toll: He looks pale and rattled. He bums a cigarette from his neighbor and ducks out a side door.
All day, there have been brief, unproductive upticks, but much longer downticks. The S&P 500 has broken its 2008 low, according to CNBC, which after several hours is beginning to look more and more like an offtrack-betting monitor.
But just as the day’s market looks like a wash, the upticks in the S&P 500 start lasting longer, the downticks shorter. The market is constantly going up and down, but a new pattern starts to repeat, over and over, minute by minute, consistently breaking through the resistance levels the traders have drawn on their screens. Soon it’s clear that the S&P is going up more than it’s going down: There is a reversal happening. “There were some buyers stepping in, which is a really good sign,” Milman says, visibly relieved. “I couldn’t be happier right now.”
To monitor the S&P 500 even more closely, Milman looks at a so-called candlestick chart on one of his monitors, a series of green and red bars showing the trading direction over 30-second intervals. The bar looks like a segment of a stereo equalizer, pulsing to some invisible beat.
“Wait for setups, guys. Don’t just jump in,” says Milman, directing his team to wait for a signal that might predict the next upward strike. “You look for the chart to tell you this is a legitimate resistance point or support point,” he says. “Once my stock goes through, I’m going to get in.”
He cracks his knuckles. “Jesus.”
“There’s no pure science to it,” says Milman, recalling a day in October when he lost $100,000. “I made it all back in the next two days, but it was rough.”
Bush comes on the TV screen. He says free-market capitalism will prevail. “Is anybody listening to this?” asks a trader. “No,” says another emphatically and turns off the volume.
Milman jumps in but takes an unfortunate ride on Goldman Sachs, the chart of which suggested to him a renewed climb (the stock price broke a resistance level he’d been monitoring); instead, the stock peters out, taking Milman’s money with it. Milman urges it up, like it might hear him. “C’mon, Goldy, go! Go positive, you bitch … Come on, Goldy, get through this fucking level.”
He quickly sells off, takes a loss, and angrily clicks the Goldman chart off the screen. He’s now $600 in the hole. “Goldy, I’m disgusted with you.”
“It’s one of the go-to stocks that we trade,” Milman later tells me of Goldman Sachs. “It’s got volume, it’s got price fluctuations, it’s still one of the most expensive stocks.” Then, of course, there’s the most obvious data point of all: “It’s one of the few banks in business still.”
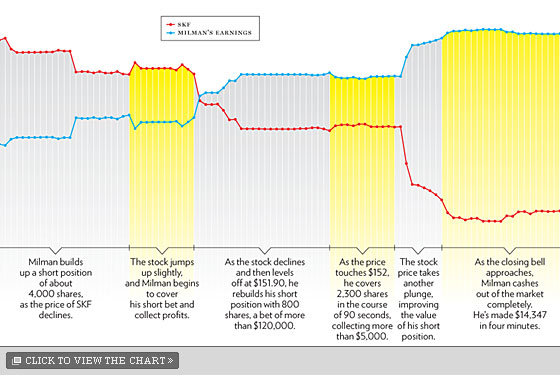
The other thing Milman and his friends spend a lot of their time trading is a single financial instrument called UltraShort Financials ProShares, which has the ticker symbol SKF and which they refer to as “Skiff.” A so-called exchange-traded fund, or ETF, it isn’t technically a stock but a combination of options meant to make a doubled-down bet against financial stocks, improving dramatically in value as companies like Goldman Sachs get hammered. (Just as often as he buys Skiff, Milman sells the fund itself short, effectively betting that financials will go up. He just uses it like a football, running it up or down the field.) Because Skiff tracks a broad index of stocks, it helps Milman avoid getting stuck on any individual stock that might behave unpredictably relative to the rest of the market. It’s hugely popular with day traders right now because it exploits the wild contortions in bank stock prices. It also tracks closely to the S&P 500 Futures Index, which Milman follows as a kind of canary in the coal mine, a second-by-second impression of the market’s overall direction.
Milman’s wife, Jenny, a professional caterer, checks in by IM. Milman tells her he’s trading poorly. “I love you,” she messages back, followed by a sly poke: “idiot.”
Milman sighs, slumping back into a funk. He has to wait for the next ride up, assuming it comes. Will it? There’s no telling. Nobody in the room was predicting a bounce this morning, and nobody can predict whether there will be another one now. But there’s a feeling of momentum starting to seep in, like this is it. You can actually feel it in the room, like somebody leaked laughing gas through the air vents. One by one, the traders are realizing the market’s going up now, kicking themselves for not buying in at the lower price, then immediately looking for a new low so they can buy in and chase the surge, be part of the momentum wave.
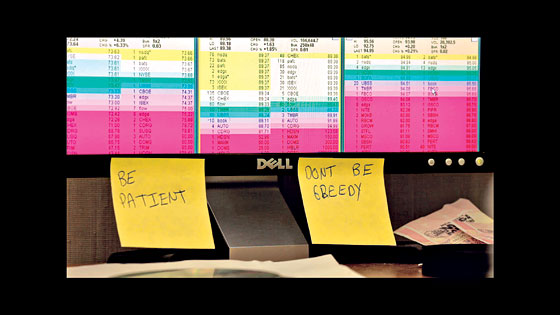
“Reversal days are the most powerful type of market moves, especially for traders like us,” Milman says. “You see stocks that are negative and [then] every stock goes positive and you can just close your eyes and pick a stock and speculate that the stock is going to go positive with the market.” As the market sinks lower, these reversal days become less frequent. With less trading comes less volatility to exploit—which is why Milman has scrawled on the group’s bulletin board, I HATE BEAR MARKETS.
Milman sees a new entry point forming, a clumped-up series of zigzags, three of them in a row, that he believes is a setup for a renewed spike, like the market is pumping itself up for its next pole vault. Milman mounts a short position with Skiff, betting financials will go up rather than down. He points to the level over which he needs the market to break. “If we can start breaking through this level, this previous high, if we can consolidate a little bit, test it, test it, and then rip through, I’ll be really, really big,” he says.
He observes what he calls a typical bull flag in the candlestick chart of the S&P 500. “There’s an up move, which is the pole,” he explains, pointing to the bobbing 30-second buy-sell candlestick, which has popped straight up, tall and green, meaning buyers have overwhelmed sellers and are possibly poised for a renewed run. “There’s the consolidation at the level, and the breakout is the tip of the pole.”
The reversal seems to be taking off in earnest now. Milman pans back for a wider view of the day’s S&P chart and points to the deep drop it made earlier and the arrowlike point—the V-shape—at which it began bouncing back just after lunch. Milman reviews: “This was called a bear trap,” he says, describing how short-sellers were suddenly forced to cover their bets, which has the effect of pushing up a stock’s value, sometimes very quickly. It’s one of the customary ways short-sellers get burned. “It rips back in their faces,” says Milman, “and the bears are like, ‘Holy shit, now what do we do?’ ”
By the end of the day, market-news reports seem to be groping around for a solid explanation behind the reversal. One trader tells the Associated Press that it’s just “a herd mentality. We started going higher, and you don’t want to be the last one on the boat.”
The green candlesticks are now punching upward in quick strikes. “Wow, that thing is moving so fast,” he says. “Fucking sick.”
Milman’s words are getting quicker, his breath shorter, his whole body more alert. As the market regroups for another surge, so does he. He quickly triples his short position on Skiff, going long on financials. The market climbs. He jams on the keys, makes several thousand dollars in a few seconds, exhaling with relief as he gets out before it zags back down. “That was a magic trick, but that was very risky,” he says, leaning back to collect himself.
“Oh my God!” says a nearby trader.
Flush with the last win, Milman sets up for another trade. “Nothing crazy, nothing crazy,” he says, rocking back and forth. “Test it, test it, and really rip through.”
“Right back up, Futures,” he says, talking to the S&P 500 gauge. It stalls for a few seconds, testing his patience: “Stop fucking around.”
He punches out an IM to his colleagues: “Looking to get absolutely monkey-ass long soon.”
From here, his monologue starts to sound like Luke Skywalker leading his squadron of X-wing pilots into the Death Star: “Futures are breaking out. We’re breaking above 81,” he intones, referring to the 881 mark on the S&P 500 Futures. A minute later, he’s up to $12,000. Moments later, $17,000. Then $21,000. He’s constantly adding to his short position on Skiff, betting on the upside for financials. The S&P agrees. Seconds tick by. The green candlestick spurts up rhythmically, green, green, green. “My God,” says the trader named Chad.
“C’mon, let’s see some buy programs kick in,” Milman says, hoping banks and hedge funds will give chase and move the prices even higher.
At 3:27 p.m., he’s made $24,700. “Oh my Skiff!” declares Milman. “Are you serious? Oh my God!”
There is disbelief all around. A big trader friend messages him on the screen: “$270k swing today for me on 2m!!”
3:45 p.m.: “We’re going higher!” Milman says, his profit-and-loss gauge whizzing past $27,000. His fingers flick away at the computer keys, buying several thousand shares on the down dips, selling off in 100-share increments as it climbs and crests on its next run.
He’s screaming at the S&P 500 Futures Index to tack on points as each one flips more green numbers on his profit-and-loss gauge. The S&P is back down but preparing its next climb, to 901, 902 …
“C’mon, threes,” says Milman, with six minutes till the closing bell. “C’mon, fours, bitch. C’mon, fours, higher!”
“Treasury Secretary Paulson says major institutions have been stabilized,” intones the news announcer.
“C’mon, panic buyer! Let’s see five. Don’t be shy. Fives, baby. C’mon!”
Thirty-six thousand dollars.
“This is a volatile motherfucker. Holy Skiff!”
He’s tapping furiously.
Taptaptaptaptaptap.
He’s nearly sold off.
“Got 2,000 left.”
Taptaptaptaptap.
3:57 p.m.: $42,000.
Taptap.
“Oh my God. Finished.”
He pushes away from the desk with a great exhalation, eyes glazed over, the whole room reeking of body odor. The chatter starts to rise as traders stretch and eyeball each other’s screens to gauge their relative success or failure. A man in Milman’s group stares at his screen as if through a broken windshield. At two minutes till the bell, he glances over at Milman’s screen: He’s up $50,000.

Peter Milman Describes His Addiction to the Stock Market
See the Video