
Runs batted in—RBIs—aren’t always a useful measure of an individual hitter’s skill, because you can only drive runners in when they’re already on base for you. A great player on a bad team might not get as many RBIs as an okay player on a great team.
Did you find that statement almost insulting in its obviousness? You wouldn’t have seven years ago, before Michael Lewis’s Moneyball was released, when such sabermetric notions—“sabermetrics” is the name for the science of studying baseball statistics—were the subject of hot debate around the game, their proponents pilloried as clueless, computer-addled nerds by tobacco-chewing, road-weary baseball lifers. Now it seems silly that anyone ever found those ideas controversial.
But that doesn’t mean that Moneyball no longer has anything to teach us. Moneyball wasn’t ever really about RBIs, or walks, or any other stat; it was a business story about a small firm (the Oakland A’s) finding inefficiencies in the market for baseball players, inefficiencies that could allow it to compete with industry titans like the Yankees and Red Sox. The A’s realized that statistical analysis was underused—but soon, of course, the big firms caught on. Young sabermetric general managers are everywhere now, from 36-year-old Theo Epstein in Boston, who already has two World Series rings, to 32-year-old Jon Daniels in Texas. Yankees G.M. Brian Cashman has said he incorporates stathead insights into his decision-making.
The question of how to study baseball has been settled, although no one has tried to replace scouts with robots—every team now evaluates players with a combination of statistical analysis and firsthand observation. But there is still much to be determined. Can statistical analysis and video breakdown of throwing form help figure out which flamethrowing college pitchers are less likely to get injured after they’re drafted? Can it tell you exactly which players on your team should hit and run in the seventh inning of a one-run game? What proportion of its budget should a mid-market team spend on minor-league coaching relative to high-school scouting in order to maximize profits? There are a million questions to choose from, but right now the most cutting-edge research is in the mysterious, ethereal, and, most maddeningly, subjective world of defense. And that quest to objectify the subjective has opened a new front in the battle between the Yankees and their eternal enemies, the Red Sox.
John Dewan is the former president and CEO of Stats—the company that provides statistical services for every major American sports league, including Major League Baseball—who in 2002 founded Baseball Info Solutions, which “specializes in collecting, interpreting, and disseminating in-depth baseball statistics.” Each season, the company pays fifteen to twenty video scouts whose lone job is to watch every single Major League Baseball game and notate everything that happens. Every. Single. Thing. “Each of our video scouts has a computer screen with a replica of the field and about 50,000 pixels to choose from to determine the exact location of every batted ball,” Dewan says. “We mark the exact location and velocity of everything.”
Dewan’s staff has to do this all by hand, of course; finding ways to statistically measure fielding makes the Moneyball-chronicled process of rethinking hitting-and-pitching statistics look like a real cakewalk. The old batting statistics weren’t perfect, but they were the building blocks of better measures. The only commonly kept fielding stat, by contrast, was “errors,” which should have long ago gone the way of the bull-pen car. Errors are merely a tally of blatantly noticeable mistakes, which are a minuscule part of what happens in the field. A hitter’s job is easy to quantify: He succeeds in getting on base (or hitting the ball out of the park) or he doesn’t. But countless variables can affect whether a fielder even has a chance to make an error: where he’s positioned, how quickly he reacts to the ball off the bat, what route he takes toward it, how quickly he gets the ball out of his glove, how hard he throws the ball to another fielder. It’s still important to catch the ball cleanly once you get to it, of course—but in the skilled world of professional baseball, almost everyone makes the easy play almost all the time. It’s how many of the hard plays they give themselves the chance to make that’s much more important.
But how do you decide whether the left-fielder should have been in better position to catch a shallow, looping fly ball? For almost its entire history, baseball’s simple answer was: You don’t. You mark errors and leave everything else up to individual judgment. But using improved technology (most notably easy-to-access online video) and clever reasoning, Dewan and his analysts have come closer to figuring out defense than ever before.
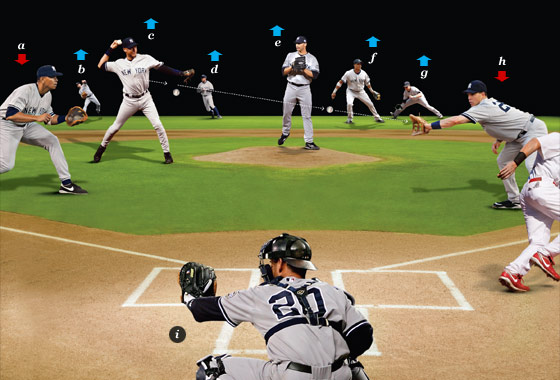
Dewan has long known “errors” were an insufficient defensive barometer, but he also thought other companies, including his old company Stats, weren’t even getting the more nuanced details right. Dewan has each of his scouts note not only where the ball was hit but also its type (grounder, fly ball, line drive, or “fliner”) and an estimate of its speed (on a scale of “slow” to “hard”). He says he has quantified the exact lengths of time a ball that is hit to the gaps between the center-fielder and the right- and left-fielders needs to be in the air so that almost every outfielder will catch it (six seconds) and so that almost none will (three seconds). The goal is to figure out what balls certain players get to and others don’t. A fly ball hit to center in Citi Field might look something like this:
Vector 187 degrees. 290 feet.
Medium. Fliner.
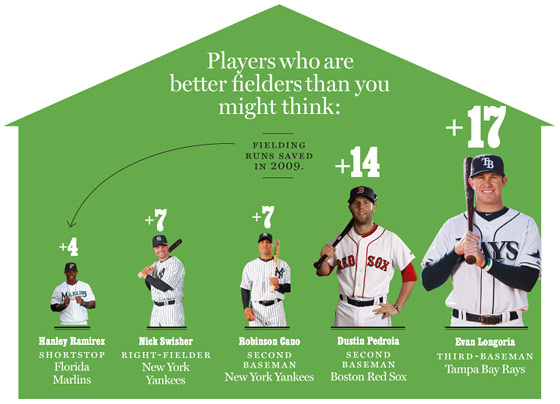
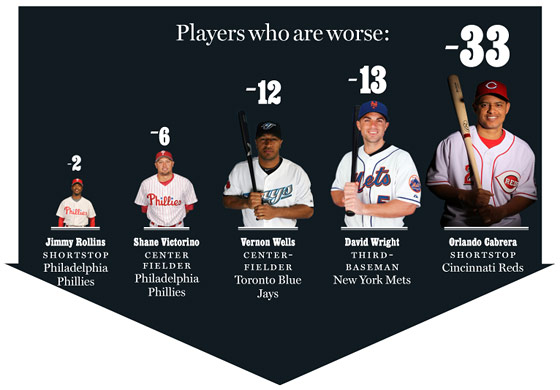
At the end of the season, Dewan has a complete log of every fliner hit in the major leagues to each of roughly 3,000 zones. He can see which center-fielders caught the most and which caught the least. And using that information for every tiny zone of the field, he can tell you how every player in baseball plays his position relative to everyone else. It’s an extremely structured method of collating subjective judgments. Dewan and company published their results in a 2009 book called The Fielding Bible: Vol. II, which features two proprietary statistics: Plus/Minus and Runs Saved. Plus/Minus is the exact number, tabulated on a play-by-play basis, of plays a defender makes above or below the league average fielder at that position. Thus, at shortstop, Jack Wilson has a Plus/Minus of +32: He made 32 more plays than the average shortstop. That’s transposed into the Runs Saved number, which is the number of actual runs prevented by the fielder; for Wilson, it’s 27, the best in the game at his position. (The process of converting Plus/Minus to Runs Saved is too complicated to explain here, but it’s laid out in Dewan’s book in not-incomprehensible language.) And though no one will confirm it on the record, it is widely believed that Plus/Minus and Runs Saved—thanks to Dewan’s professional connection to Bill James, who now works for the Red Sox—served as the foundation of the Sox’ off-season moves.
The major free-agent acquisitions of everyday players by the Red Sox were not particularly major, at least by the nuclear terms to which we have grown accustomed. The Sox added third-baseman Adrian Beltre, shortstop Marco Scutaro, and center-fielder Mike Cameron. If you’ve heard of all three of them, you’re probably a pretty big baseball fan. None is a regular All-Star or a major offensive force: Beltre hit only eight homers last season, and Cameron is 37 years old and has hit over .270 only once in his career.
What they do well, though, better than almost anyone else in baseball, is play defense. In 2009, Beltre made 26 more plays than the average third-baseman, saving 21 runs, good for third best in baseball at the hot corner. Last year’s primary Sox third-baseman, Mike Lowell, made 23 fewer plays than the average, costing his team eighteen runs. Right there, at one position, that’s a 49-play-above-average improvement, with 39 more runs saved. The generally accepted sabermetric formula is that ten runs saved (with the glove) or created (with the bat) equals one win. With one position switch, the Red Sox might have made a four-game improvement before Beltre takes a single swing of the bat. You can do the same math in center field: Cameron saved three runs last year with the Brewers, while Jacoby Ellsbury, who is moving from center to left this year, cost his team nine: a twelve-run difference, one win. Ellsbury’s shift to left? As a left-fielder two years ago, he saved his team five runs in only 36 games started; 2009 left-fielder (and new Met) Jason Bay cost the Sox two last year. There’s at least another win right there. At shortstop, Scutaro saved twelve runs for the Blue Jays last year; the Sox’ revolving shortstops cost their team nineteen. Three more wins there. The Red Sox have dramatically improved their team’s chances of catching the Yankees without having to shell out nine-figure, decadelong contracts. “In the old days, and even some people today, you’d look at the Red Sox off-season moves and say, ‘They clearly lost more on offense than they gained on defense,’ ” Dewan says. “Now we’re able to measure it, and tell just how much more they gained.”
The Yankees have the exact same idea about defense. They actually made one huge improvement before last season: Mark Teixeira might have tied for the American League lead in homers last year, but just as crucially, he saved twelve more runs (per Dewan) than the lumbering Jason Giambi, which translates to a full win. This off-season, the team decided not to bid for free-agent left-fielders Bay and Matt Holliday, choosing instead to use Brett Gardner to replace Johnny Damon in left field and acquiring the bargain contract of Curtis Granderson via trade to play center. Damon was one run worse than the average left-fielder on defense last year, while Gardner saved nine runs in his limited time in center. Left field is easier to play than center, so Gardner should be even better there, a vast improvement over Damon. Meanwhile, Granderson will probably be substantially better than the Gardner–Melky Cabrera platoon in center. Overall, the Yankees’ outfield defense should be at least two wins better this year, while on offense Granderson will likely match if not exceed the offensive production lost by the departure of Damon. What’s more, he makes only $9 million a year, which is $7.5 million less than Bay and $8 million less than Holliday. All told, using Gardner and Granderson is a way to keep up the defensive improvements of last year—Dewan says the Yanks improved by 41 runs in 2009, amounting to four wins—without costing anything significant on offense or the bottom line. The Yankees and Sox, baseball’s titans of profligate spending—of $50 million bidding wars for players like Daisuke Matsuzaka—are now locked in an equally intense battle to see who can be more subtly ingenious and fiscally responsible.
Runs saved isn’t the only defensive metric out there: Ultimate Zone Rating, put together by a sabermetrician and former Cardinals consultant named Mitchel Lichtman, is more widely used than Runs Saved because it’s publicly available on the FanGraphs site without a subscription. (You must pay a monthly fee to Bill James’s website to access Dewan’s numbers.) There are several more systems, but they’re all based on the same concept, of dividing the field into zones and comparing each fielder to his peers; they only occasionally disagree on a player (Dewan is a slightly bigger fan of Mets outfielder Jeff Francoeur than Lichtman is). If you want, you can go to the message board of Lichtman’s website to see him and Dewan arguing over, for example, the ways their final rankings make sure not to punish outfielders who played in particularly large outfields. In the end, as Baseball Prospectus co-founder Clay Davenport says, “everyone’s pursuing variations of the same idea,” and the competition between metrics leads to greater accuracy for all.
That’s a good thing, since the field is still young and subject to volatility. Consider the example of Derek Jeter. For the first part of his career, Jeter was regarded as one of the best fielders in the game, but the reputation was mostly based on the anecdotal observations of sportswriters, broadcasters, and managers impressed by his jump throws from the hole at shortstop and his famous “flip play” against the A’s in the 2001 American League Division Series. (He won three Gold Gloves in a row, starting in 2004.) But defensive metrics like Dewan’s showed him to be not only an overrated defender but in fact a wretched one. His Runs Saved number was -28 in 2005, -18 in 2006, and -23 in 2007, making him one of the worst shortstops in baseball all three years. (As far back as 2001, Baseball Prospectus famously described Jeter’s defense as “yecch.”) But in the last two years, he has improved dramatically in Dewan’s estimation, a highly unusual development for a player in his mid-thirties. His Runs Saved number was -9 in 2008 and actually +2 last season.
Did Jeter get better, or did the numbers become more accurate? Probably both, but it’s impossible to be too precise; there are fielding-statistics innovations yet to be made. (For example, none of the leading fielding metrics measures the defensive abilities of catchers, who are the most important defensive players on the field.) The reason this data is so rare and so valued is that it’s extremely labor-intensive: Not everyone—not even most teams—has a staff of people available to pore over 2,430 baseball games. And even if they do, there are still a lot of human judgments—see Dewan’s “slow” line drives—in between what happens on the field and what comes out in the numbers. The “zones” concept is more advanced than any kind of fielding evaluation that had been done before, but it’s still a relatively crude way to describe what happens on a two-acre baseball field to balls hit with infinitely varying levels of speed and spin and trajectory.
To that end, analysts and observers are eagerly awaiting the data from MLB Advanced Media’s Hitf/x system, which tracks the actual trajectory of the ball when it comes off the bat, in a similar way that its Pitchf/x, introduced a few years ago as part of its MLB Gameday online function, tracks the curve, break, and velocity of pitches. The two systems require special cameras installed at every ballpark, and Hitf/x is not online yet. “Once that information is out there,” Davenport says, “there will be a rush to get the best analysis, with lots of claims and counterclaims that will ultimately be sorted out. How people extract the data will be an ongoing thing, but we know it will bring us closer to making defense as objectively quantifiable as offense. Someday, the notion of watching these plays on video may seem archaic.” Fielding geeks will no longer have to manually figure out how many balls were hit on vector 187 and make a judgment about the left-fielder’s play; they’ll be able to query a database of balls hit at a 30-degree angle to the third-base line, with between 40 and 42 degrees trajectory upward and 90 and 100 miles per hour speed off the bat, and see exactly how many were turned into outs by which players.
By the time that happens, other teams will have caught up with the Yanks’ and Sox’ analysis—Dewan estimates that only ten or fewer teams do serious research into advanced defensive metrics—and Ultimate Zone Rating and Runs Saved will go the same way OBP and OPS went, to the mainstream, where everyone knows and accepts them. And then there will inevitably be something else to study: Dave Cameron of FanGraphs suggests that older players like Damon and Jim Edmonds are undervalued (advancements in kinesiology and physical therapy have changed the way players age in ways that haven’t been quantified yet), and some think that speed and base-stealing have gone too far out of style (the last decade of mammoth home-run totals made one extra base seem almost piddly; with home-run totals dropping—perhaps because of steroid testing—baserunning becomes relatively more important again). “As much as it might seem, sabermetrics is not rocket science,” Lichtman says. “In the world of science and applied math, it is frighteningly simple, comparatively. Defensive metrics are a little more complicated, but not much more. They’ll get it figured out, and they’ll move on to the next thing.”